Resolving CLS Issues with Browser Tools

A main factor of why your Core Web Vitals Assessment may not be passing when you’re evaluating your website on PageSpeed Insights, or looking directly through the Search Console, could be the dreaded CLS or Cumulative Layout Shift. Before getting too far we’ll have to discuss briefly what this is.
A Cumulative Layout Shift occurs when page content literally moves in unexpected ways during user interaction or page load – Google defines this as the entire lifespan of the page. How this happens could be due to a lot of different things. For example maybe dimension attributes weren’t defined on images or videos. This would cause a shift because the browser did not accommodate the necessary space for those assets to load. A great article to read to see this in action is straight from Google and they provide a lot of different examples.
Now, in a real world context this can sometimes be really hard to fix because arriving at the conclusion of what to fix can require a lot of educated guess-and-check until you successfully figure out what the culprit is.
For example, let’s say we have a page that has a layout shift and the tools that have been run have identified a lot of different sections and content on the page that are moving and adding up the CLS score. The first thing to understand is that it’s very likely not all of these items that are causing issues, but one or more root causes that are causing a cascade of shifting elements and thus they’re all flagged.
It becomes the job of the developer to become a CLS detective and discover the root cause so that all issues become fixed in one fell swoop. I will say that occasionally this could seem to be a daunting task if you haven’t built the website. Maybe it’s also using a JavaScript library or a visual plugin that renders to the front end. The issue can become obfuscated especially when it concerns code that you can’t alter directly in an editor.
Let’s dive into an actual situation I encountered and how I ended up fixing the issue:
Reviewing The Problem
At some point recently after the new Idea Marketing Group website had launched in early 2023 it was brought up that our rankings data was showing unexpected results. It was discovered that our Core Web Vitals Assessment was failing which can affect how Google ranks your website. Despite great scores for Performance, Accessibility, Best Practices, and SEO this was still failing because one of the three types of assessments wasn’t passing. After some inspection I noticed that it was due to our CLS score.

The three assessments are Largest Contentful Paint (LCP), First Input Delay (FID), and Cumulative Layout Shift (CLS). The list of vitals to see what makes up the entire Core Web Vitals can be seen here again courtesy of Google. As a brief sidenote, usually LCP and FID can be drastically improved or solved by using a cache, a CDN, or a combination of the two. You may even want to consider if your host is the right choice if performance isn’t where it should be. If you can’t or don’t want to go that far I would look into the assets (images mostly) that are rendering and see if those can be optimized or if some scripts or plugins can be removed.
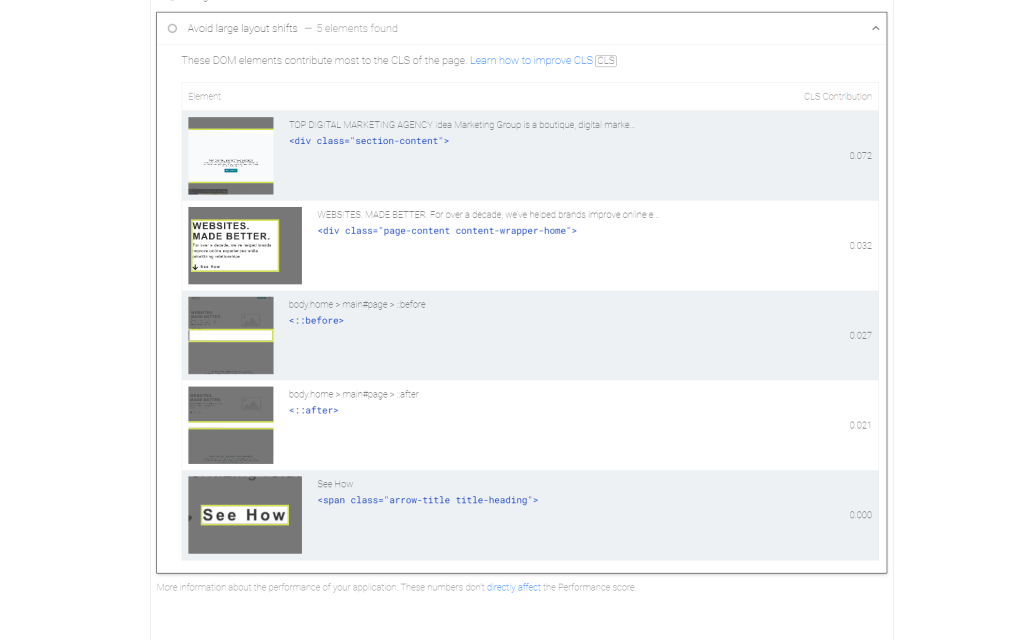
Anyway, as I mentioned we were suffering from a sub-optimal CLS score and what PageSpeed was reporting back to us was a big list of sections that were shifting. It doesn’t really provide more helpful details specific to your actual issue though.
Further Investigating
The logical first place to start is with this list of items. You should look into if anything with the styling might suggest a shift is happening. Perhaps there’s an animation that is unintentionally bumping some content. Afterwards, the next step is to take another pass on your image and video assets if they exist. Make sure these have dimension (height and width) attributes defined or they can become an issue.
If nothing obvious is coming out from these initial tests then let’s start using our web tools! I personally use a combination of Firefox and Chrome, but for this in particular I prefer using Chrome DevTools because of how good the reporting is.
In DevTools you can go to the Performance Insights tab and record a new profile of your site. This will create a ton of data to show you, but you can just focus on your issue at hand. In the case of this website it shows our layout shifts in purple and gives us an idea of when and where they’re occurring.
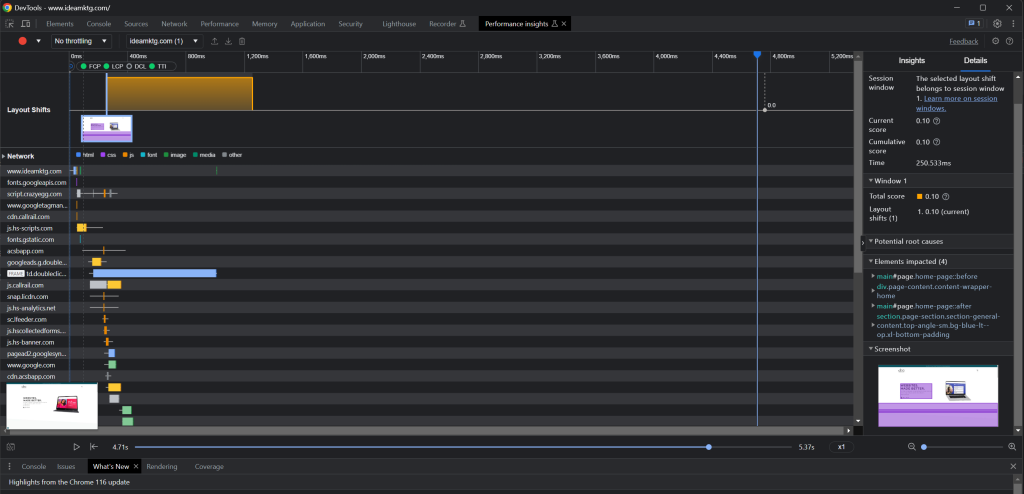
Running this report gives us more information on the general area of focus for the layout shift. I also suggest getting a recording using the Performance tab as well in order to get more data.
At this point I made a few adjustments, but really couldn’t figure out what the main issue was. I thought I had solved it initially because the video element didn’t have proper dimensions for what the actual output was. And what else was curious at this point was that sections were still being flagged that didn’t have issues that I could tell would be problems.
After mulling it over a bit I decided to turn the Layout Shift Regions tool on within the Rendering tools. This can be helpful, but I do wish that the highlight was more persistent. However, I was able to see that everything was shifting based on elements in the header area. From my observation the root cause had to be either the video or the content next to it. This came from a combination of the layout flash and the other highlights using both Performance and Performance Insights tools.

A Solution Presents Itself
After I started getting closer to solving the problem I pulled out my last test which is systematically hiding elements on the page and seeing where the issue is coming from. If everything passes when a section is gone then you know where the problem is at. Definitely make sure you’re doing this on a staging site! Sometimes this doesn’t always work as intended so I wouldn’t recommend abandoning other methods either.
Personally to keep this process a bit simpler though I would suggest writing out some test cases that you can reference again in the future. If you’d like to see more ways to debug then Google has you covered.
I found that indeed the issue was coming from the video section. After tinkering with the styling a bit, I figured that something must be happening when the video loads and that the needed space still isn’t being reserved for it. I ended up adding a minimum height to it that matched the height of the video itself and its height attribute and boom, problem solved. Once I ran tests again using Lighthouse it showed that the CLS issue was finally gone.
Now what’s interesting is if you look back at the image of reported items from Google, of the sections that were shifting, you’ll see that the video wasn’t even there! It’s basically highlighting the items that are shifting because of whatever the issue is. The actual issue that needed to be fixed wasn’t directly made clear and is the core of why solving these problems can be tough.
Keep in mind that although tools like PageSpeed Insights are reporting issues on your website you need to be patient with the results. Core Web Vitals are taken from metrics over a 28 day reporting period meaning that if you fixed your issue today it may not reflect on there or in your Search Console for a while. See this support thread as an example of what I mean.
Pro Tip
Something to do to encourage yourself is to run the Lighthouse tool in your Chrome DevTools. This is one of my absolute favorite tools to use because it doesn’t require your website to be accessible in order to be crawled. Maybe you have a coming soon page up and can’t run PageSpeed because Google can’t access it? Use Lighthouse! It reports the same metrics back and in some cases can give you results quicker.
What this will do, for example, is show a look into your CLS score at this moment in time. Make sure you’re using the Navigation mode. Once you’ve fixed the issue, run the test until it passes. This can give you some certainty that when Google refreshes its data it has on your website, after the 28 day period, that the issue should be fixed.
P.S. Check to see your website is able to perform well against INP tests as that will shortly become a new test criteria for validating Core Web Vitals. You can view this info in the Search Console for your website!